Business Health Monitoring
Delivering a smart software solution to monitor your business health by just feeding your major business vital signs. Your business requires pre- and post-analysis to take immediate corrective measures, analyze areas of improvement, or set new goals for future business growth. That’s all our business health monitoring can do for you!
Centralized Your Business Venture
ERP
This business health monitoring allows you to integrate with any existing and latest-built ERP system like Epicor, SAP, NetSuite, etc.
CRM
Inventory Management
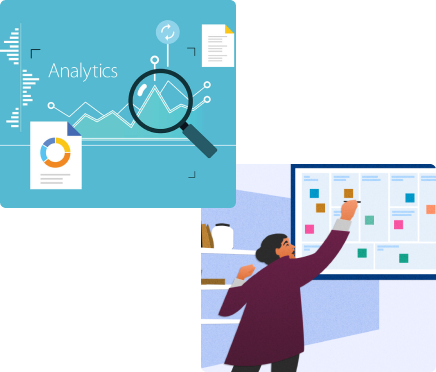
The Impact Of Business Health Monitoring
- Help businesses monitor their most critical KPIs, such as revenue, expenses, customer satisfaction, employee productivity, and more.
- The ability to provide real-time data and alerts allows businesses to react promptly to any issues or changes in their vital signs.
- Presenting data in easy-to-understand visual formats like graphs, charts, and dashboards makes it simpler for users to interpret and act on the information.
- Businesses should be able to select which KPIs are most relevant to their specific industry and goals, ensuring that the software is tailored to their needs.

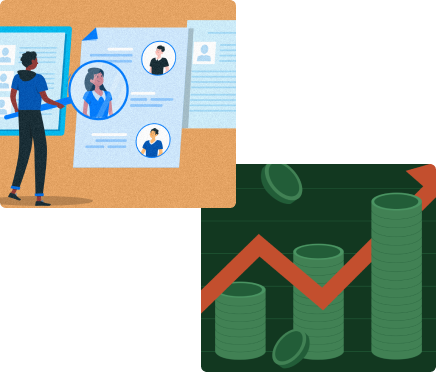
Redefining Business Verticals For Better
- Implementing automation features can help save time and reduce human error in data collection and analysis.
- Users can set specific targets for their KPIs and track progress toward these goals over time.
- Offer customer support and resources to help users maximize the benefits of your software.
- By identifying areas for improvement and taking corrective measures, businesses can potentially reduce costs and increase efficiency, resulting in improved profitability.

Streamline Organizational Progress
A smart, cutting-edge business health monitoring solution to dignify growth opportunities by analyzing the past, improving the present, and predicting the future.

Our Development Process

Planning & Execution
From gathering requirements to brainstorming unique ideas, our first step is to listen to our client's preferences and plan the whole project deliverables to create a deadline.
Design & Prototype
We align professional designers to work on creating the user interface, from low-fidelity to high-fidelity design and prototyping, which must deliver an exceptional user experience.
Development
Our development process involves writing custom codes and integrating APIs to make the design functional of extensive resources of diverse technology to be parallel with industry-competitive solutions of preferred tech stack to build complex features and functionalities.
Testing
To verify and evaluate the quality of the codebase, our testing process ensures that every corner of the solution is working and bug-free before delivering the project.
Launch & Maintenance
Proper design and development, along with implementing security protocols, allow us to launch safe, bug-free products that fulfill our clients' requirements.Our Some Great Work On Business Health Monitoring
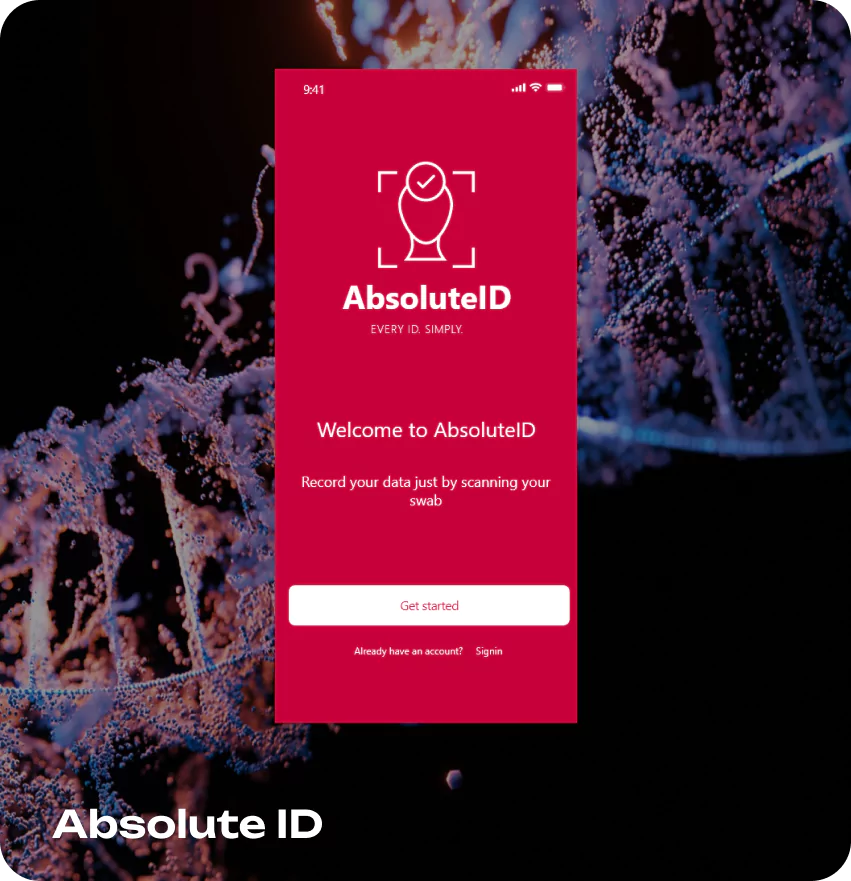
Absolute ID
Build Link
What Our Clients Are Saying
Outstanding Customer Satisfaction
Great experience working with this excellent team for the development and launch of my App. Worked closely with key members Trevor, Jessica & Moona who all displayed diligence and constant sense of urgency. Prompt attention and quick resolution of concerns contributed to a seamless experience.

Chantal Wega
Founder
A Game-Changer for My Business!
My experience was 5/5 and it started with customer service. After speaking with Trevor he helped me out a lot. He even sent me a few options to see what project I liked the most. He gave a timeline for when the team would complete the job I asked for and they were right on time. Will absolutely return for future projects.

Matt Connelly
CEO
Flawless Service
I would definitely recommend this company. Trevor Michaels, Project Coordinator was AMAZING from beginning to end. He was thorough, patient and understood the task at hand. We were truly pleased with the outcome. Thanks again Trevor for your professionalism and for providing flawless service!

Karen Popplewell
Owner
Top-Notch Services
Richard and his team did a great job contacting me and keeping me updated regarding my project. I was in the process of trying to build my project on my own, and it looked terrible; however, Richard and his team saved my project. I will keep in touch with this company when I need their help again.

Dawn Brown
Entrepreneur
Questions? Here are answers
Why is application modernization important?
What are some common approaches to legacy app modernization?
What are some common approaches to legacy app modernization?
How long does the legacy system process take?
How much do app modernization services cost?
How can we ensure that our modernized legacy apps stay up to date?
Our team of experts is ready to provide you with cutting edge solutions.
The Impact Of Business Health Monitoring
- Help businesses monitor their most critical KPIs, such as revenue, expenses, customer satisfaction, employee productivity, and more.
- The ability to provide real-time data and alerts allows businesses to react promptly to any issues or changes in their vital signs.
- Presenting data in easy-to-understand visual formats like graphs, charts, and dashboards makes it simpler for users to interpret and act on the information.
- Businesses should be able to select which KPIs are most relevant to their specific industry and goals, ensuring that the software is tailored to their needs.


Redefining Business Verticals For Better
- Implementing automation features can help save time and reduce human error in data collection and analysis.
- Users can set specific targets for their KPIs and track progress toward these goals over time.
- Offer customer support and resources to help users maximize the benefits of your software.
- By identifying areas for improvement and taking corrective measures, businesses can potentially reduce costs and increase efficiency, resulting in improved profitability.
Streamline Organizational Progress
A smart, cutting-edge business health monitoring solution to dignify growth opportunities by analyzing the past, improving the present, and predicting the future.

Complete Business Health Monitoring Solution
Easy Profile Account
Create an account by adding your complete information or connect with Google or LinkedIn.
Connect Company Profile
In-depth information about your business to deeply diagnose organization health.
Vital Sign Association
Connect the dots between two or more vital signs to analyze the dependency of each business function.
Tolerance
Set the criteria to judge the performance level of the organization's functional areas.
Primary Data Templates
Built-in templates represent the subcategories of the health markers with the proposition value or percentage.
Metrics Target
Entering metrics targets to analyze and evaluate after passing the time.
Business Vital Signs
Predefined 7 major vital signs of business, i.e., Finance, Operations, Sales & Marketing, Human Capital, AI and Business Intelligence, Innovation & Business Continuity, and Governance & Compliance.
Diagnoses Period
Easy to select the period you want to diagnose business health, such as quarterly, yearly, monthly, half-yearly, etc.
Diagnosis Attempt
Start diagnosis by choosing the source of data import. Either you add it manually, in CVS, or an Excel sheet, you have to define it.
Health Indicator
Predefined indicators such as yellow, red, and green indicate the business health conditions, i.e., yellow for need attention, red for critical, and green for good health.
Root Causes
Generate the root cause of critical and need-to-attention elements by analyzing health markers and matrices.
What if Analysis
Generate different health results by feeding imaginary metrics of health markers to discover improvement areas.
Scenario Builder
Creates a scenario that reveals the company's future needs and improvements in vital signs on behalf of the core data
Benchmark Source Master
Default values have been set by benchmark sources such as Bloomberg, FactSet, Capital IQ, and Refinitiv Eikon.
Benchmark Master
In this field, user-specified benchmark source details make it authentic for use in a specific region for specific industries.
Benchmark adjust Factor
Customizing benchmark-adjusted factors can enable users to put their desired figures per their needs.
Primary data type master
Measuring business health based on entering primary data such as income tax files, human capital expenditure, cash flows, etc.,
Primary Data Master
Built-in algorithms & robust analytical methodology are applied to primary data to compute “Health Indexes” for all 24 Industry Clusters.
Primary Data Master Templates
Makes users and admin tasks simpler by automated pre-built template selection to feed primary data.
User Profile
A secure database where the client's data, such as name, email, contact details, etc., can be managed.
Role
Assign multiple user roles like an alpha tester for the admin module, full access except for user management, super admin, guest, read-only, etc.
VSign Masters
Based on these vital signs, users can pick the vital and calculate the business health by the algorithmic computing system.
Health Marker Masters
Defining the sub-category of VSigns that allows the user to select in-depth factors.
Metrics Index Category
The pre-calculated results are shown in metrics and matrix index categories to set the outcome's criteria.
Unit Measures
Get desired end results in different units such as ratio, percentage, rating, months, week, hours, date, currency, days, and number.
Specify Location
Generate results or outputs based on country-specific terms and conditions.
Cities
Make the app result more specific by specifying the cities of the businesses.
FAQs
Added FAQs to the user who wants support or help if any complexities occur.
Terms Feed
Users can find terms and conditions features to read all the policies and regulations for using this app.
A Constructive Approach To Grow Your Business
- Get instant access to crucial business metrics, allowing you to make informed decisions on the spot with 98% accuracy.
- Identify potential problems before they escalate, enabling you to take corrective measures promptly.
- Compare current performance against past data to gauge progress and set 100% realistic goals for continuous improvement.
- Optimize resource allocation by identifying underutilized assets or areas of over-expenditure.
- Leverage historical data to make informed strategic decisions and set achievable milestones for future growth.
- Identify cost-saving opportunities and streamline operations for improved overall efficiency.

- Evaluate the return on investment for various initiatives, helping you prioritize projects with the highest impact on your business health that gain a 10x hike.
- Gain a clear understanding of your financial health, allowing for better budgeting, forecasting, and financial decision-making.
- Stay ahead of the competition by adapting to market trends and customer preferences based on real-time insights.
- Get instant access to crucial business metrics, allowing you to make informed decisions on the spot with 98% accuracy.
- Identify potential problems before they escalate, enabling you to take corrective measures promptly.
- Compare current performance against past data to gauge progress and set 100% realistic goals for continuous improvement.
- Optimize resource allocation by identifying underutilized assets or areas of over-expenditure.
- Leverage historical data to make informed strategic decisions and set achievable milestones for future growth.
- Identify cost-saving opportunities and streamline operations for improved overall efficiency.
- Evaluate the return on investment for various initiatives, helping you prioritize projects with the highest impact on your business health that gain a 10x hike.
- Gain a clear understanding of your financial health, allowing for better budgeting, forecasting, and financial decision-making.
- Stay ahead of the competition by adapting to market trends and customer preferences based on real-time insights.